Monitor your
workload.
VM 0001 VM 0050 VM 0200
Spot utilization spikes and compare the load across your services.

Create graphs and dashboards that make your data clear.
Create your first graphStream data from your applications and follow what changes, as it happens.
Spot utilization spikes and compare the load across your services.
See which customer groups drive revenue—and how their spending changes.
Find the campaigns growing signups at a lower acquisition cost.
 Your workspace
 Snowflake
 Notion
 Salesforce
 PostgreSQL
 Shopify
 Stripe
 Google Analytics
 ClickHouse
Upload files or send data from your systems through the SDK.
Business tools shown as integration targets; native connector setup is coming.
Describe what you want to see.
Keep control of what you create.
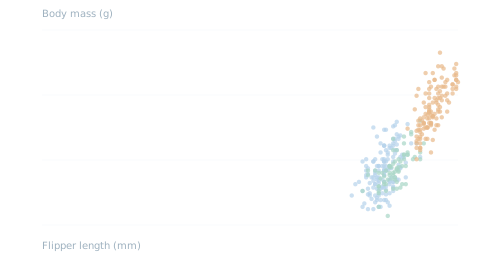
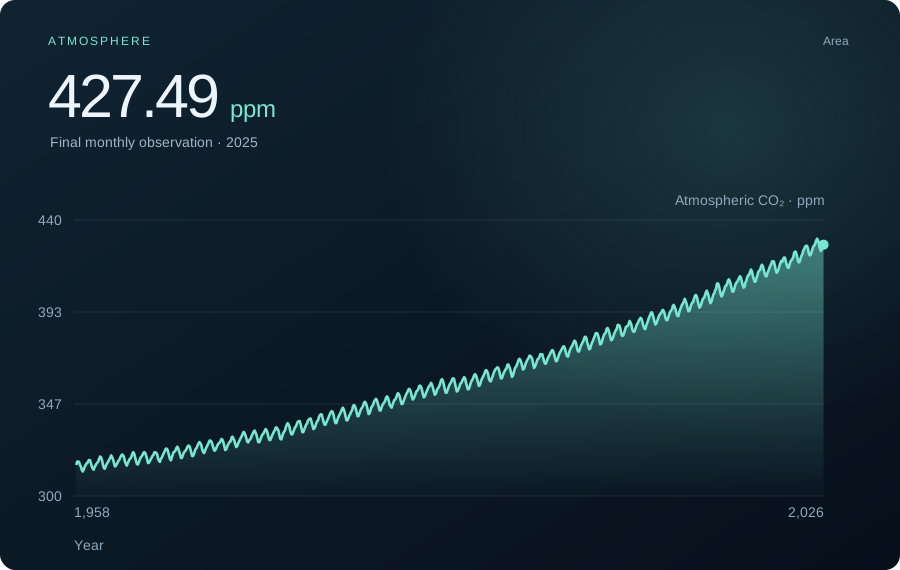
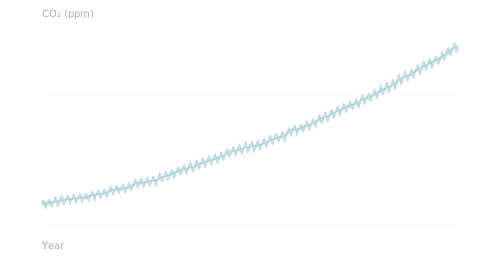 Atmospheric CO₂ · 1958–2025
Your logo, your colours and a domain you own—throughout the published experience.
// Your data. Your workflow.
const graph = await vidi.graphs.create({
  title: "Revenue by region",
  query: {
    dataset_id: data.id,
    kind: "bar",
    x: "region",
    y: "revenue",
    aggregate: "sum"
  }
});“Show the average
instead of the total.”
Explore the detail without making the browser do all the work.
GPU rendering draws your visualizations in the browser.
Explore large datasets Filter, group and calculate on the server, so your browser loads the results instead of every row.
Keep spikes in view Dense time series retain highs and lows as points are reduced, so sharp changes stay visible.
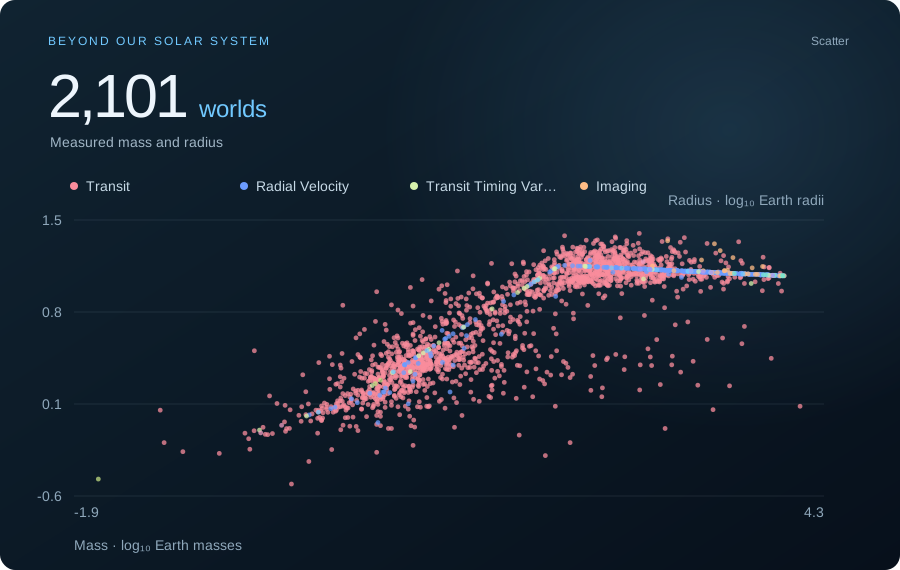
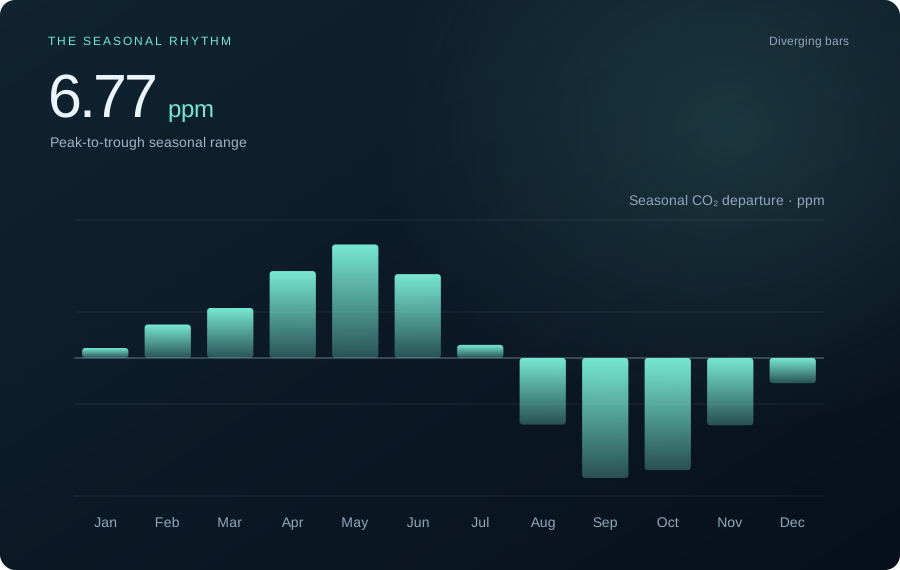
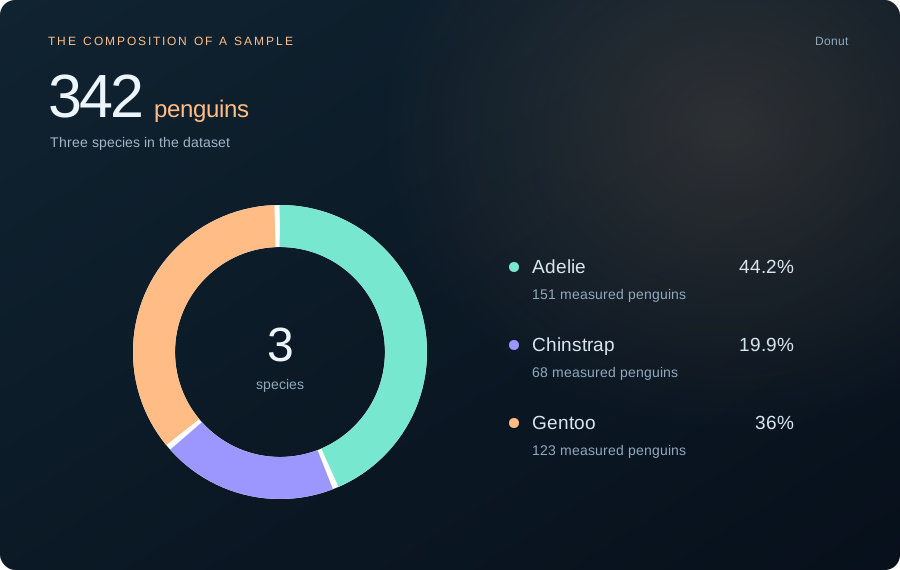
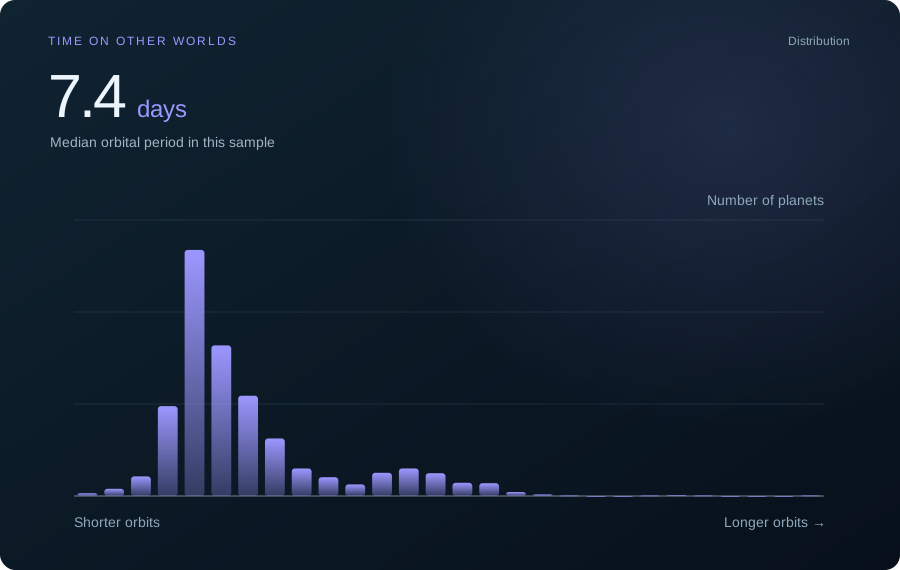
Six starting points. Real data to explore.
Open any graph, then make it yours.
What will your
data show you?